Map Data
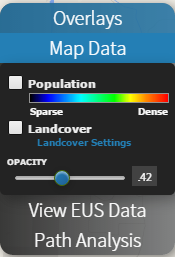
The map data on TowerCoverage.com can be located on any of your single coverages. If you open you coverage map, on the left side tool bar you will see Map Data. Clicking on this feature will provide a drop down menu that will then allow you to select which form of the map data you would like to view. Below is an example of each being displayed.
POPULATION
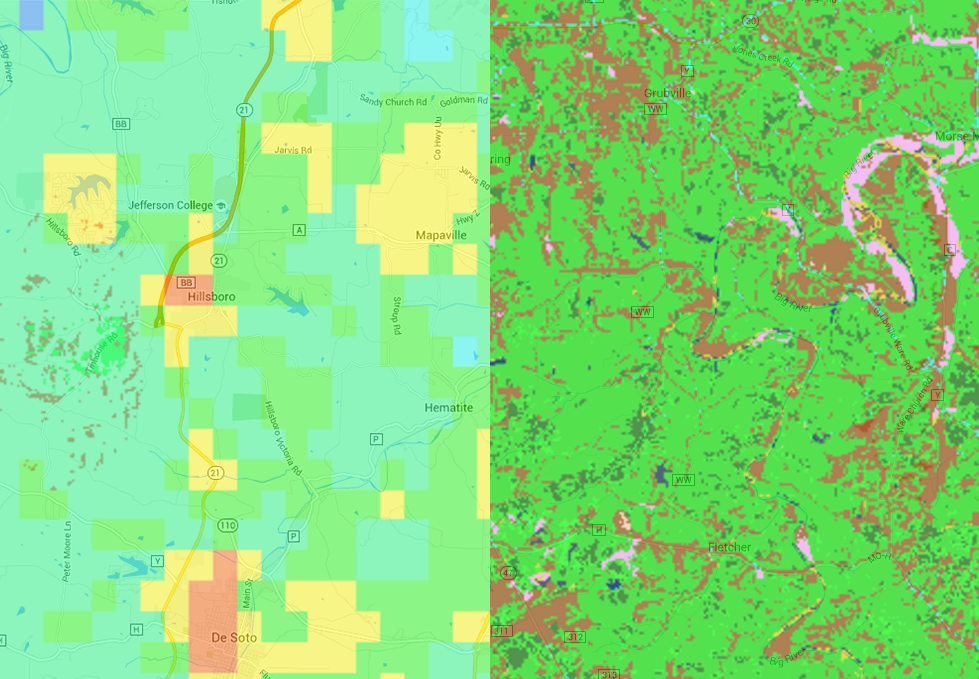
The left hand side of the image above is an example of the population data. This is the data that TowerCoverage.com uses to determine the estimated population of your coverage maps and comes from census data. This number can also be seen from an individual coverage as well as from the Multi Coverages in the upper left hand corner. Using the population data of the coverage map will allow you to see when areas have a higher population density and giving you an idea as to where you could possibly expand your coverage and receive the greatest potential for the most number of customers for your network from the smallest area.
LandCover
In the above image, the right side is an example of the land cover that can be found in your coverage area. This is the data that TowerCoverage.com uses when creating your coverage maps. All of the colors that you see are the same colors that can be found and adjusted in your Land Cover Settings. Land Cover Settings.